

Condition monitoring
Reading the time waveform: what a spectrum averages away
Quick answer
The spectrum shows which frequencies are present. The time waveform shows how they arrive: one big shock per turn, a smooth wave, or a burst that swells and fades. Many faults are only obvious in the waveform.
Why look at the waveform at all
A spectrum is a summary. It sorts the signal into frequencies, and in doing so it loses the order of events. Two signals can give the same spectrum and look completely different in time. Shocks from a damaged tooth and a smooth sine at the same rate are an example. The waveform keeps the order, and the order is the evidence.
What to look for
| Shape in the waveform | Usual meaning | Check next |
|---|---|---|
| Clean sine wave at shaft speed | Unbalance, or a bent shaft | Phase, and a balance check |
| Sine with a flat or clipped peak | Rub, or looseness that limits the motion | Look for a once-per-turn contact |
| Sharp shocks at a steady spacing | A defect that strikes once per cycle: rolling bearing, broken or cracked tooth | Measure the spacing and compare with shaft and bearing frequencies |
| Shocks once per turn of a gear shaft | Damage on a single tooth | Circular plot to find the angle |
| Wave that swells and fades at a slow rate | Beating between two sources, or modulation | Find the difference frequency |
| Narrow band close to the centre line | A healthy, lubricated rolling bearing | Use as the "after" reference |
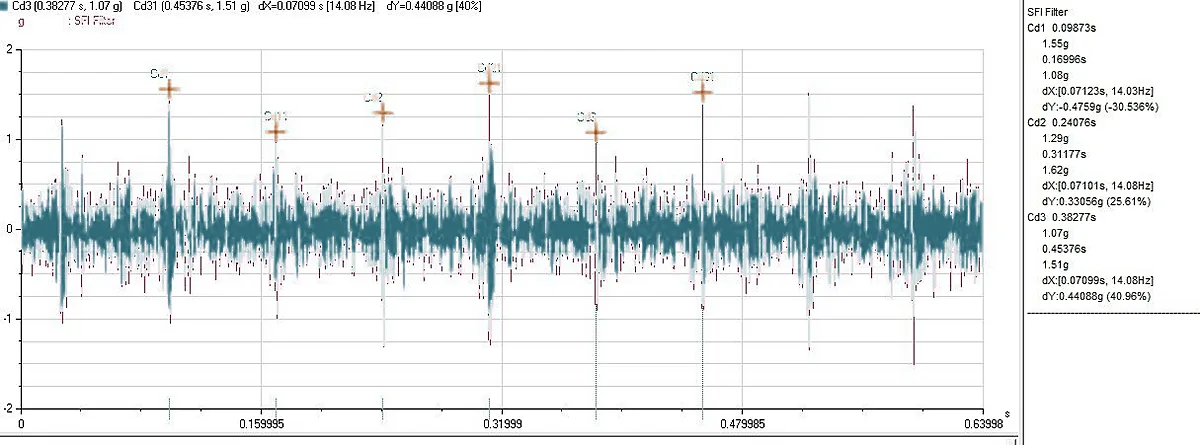
How to measure the spacing
- Place two cursors on neighbouring shocks. The instrument shows the time between them and its inverse in hertz.
- Compare that frequency with shaft speed, gear mesh speed and the bearing defect frequencies. A match tells you which part is hitting.
- If the spacing is exactly one shaft turn, the source is on that shaft, once per turn.
Settings that make or break it
- Choose a record long enough to show at least ten cycles of the thing you care about. For a slow fault that can mean several seconds.
- Use acceleration, not velocity, to see shocks. Velocity smooths them.
- Use a filter or enveloping if the shocks are buried in noise, and note the band you used.
- Keep the same settings between visits so that waveforms can be compared.
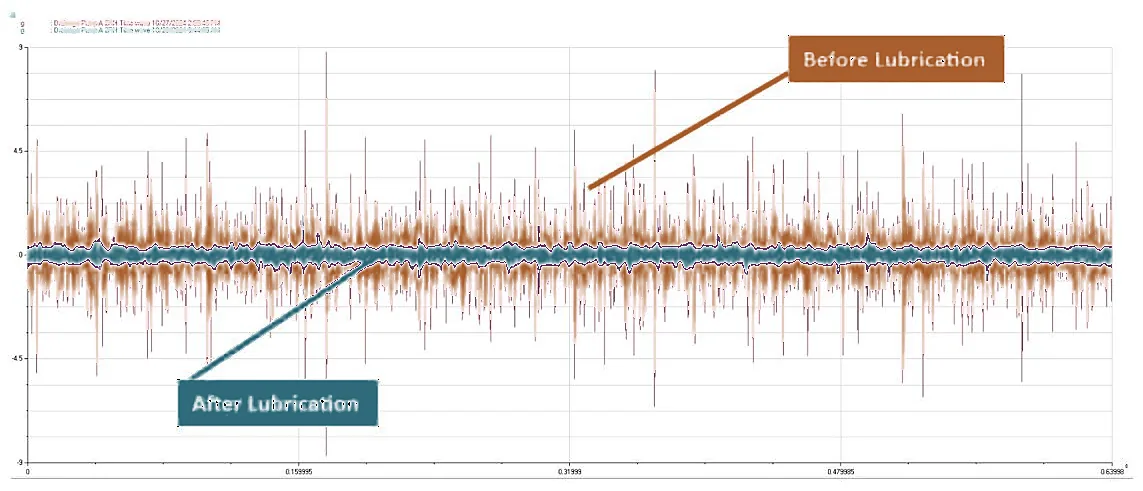
Before and after
Put two waveforms on one plot with the same scale. A repair, a lubrication change or a bearing replacement shows as a change in height and in shape. This is the plot that persuades people who do not read spectra.
Takeaway. A spectrum says which frequencies; the waveform says how they arrive. Use both, and measure the spacing of every shock.
Put it to work in the tool