

Condition monitoring
Reading a survey table: why velocity said "fine" and acceleration said "stop"
Quick answer
A survey table gives one column per measurement point. At a closed-cycle pump the velocity was under 1 mm/s everywhere, yet the pump bearing was at spall stage. Triage means reading acceleration and the defect indicators next to velocity.
A table from a real survey
| Point | Overall velocity (mm/s RMS) | Acceleration pk-pk | Defect factor | Severity flag |
|---|---|---|---|---|
| Motor non-drive end | 0.88 to 1.31 | 1.55 to 2.35 | 2.16 to 2.42 | 0 |
| Motor drive end | 1.5 to 3.38 | 2.87 to 6.77 | 2.8 to 3.7 | 0 |
| Pump drive end | 0.98 to 1.29 | 4.3 to 23.8 | 3.06 to 3.56 | 1 to 4 |
| Pump non-drive end | 0.8 to 0.96 | 3.86 to 11.5 | 4.04 to 4.51 | 0 to 5 (red at H and V) |
The pump non-drive end had the lowest velocity and the worst defect factor. Velocity measures the energy in the low and mid range, where unbalance and misalignment live. A small spall hits at high frequency and does not raise velocity.
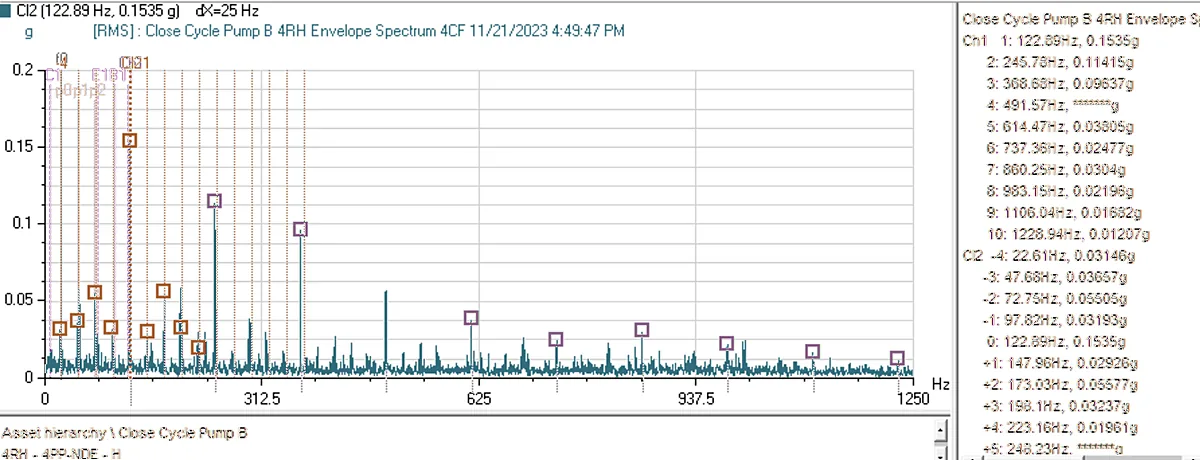
How to triage
- Sort by the severity flag or defect indicator, not by velocity.
- Read acceleration and velocity together. High acceleration with low velocity points to a bearing or a gear.
- Open the spectrum and the waveform at the worst points only.
- Look at both ends of a machine. The pump drive end here had the highest raw acceleration, 23.8, but a less severe flag.
- Plan the teardown for the worst bearing and compare it with the data.
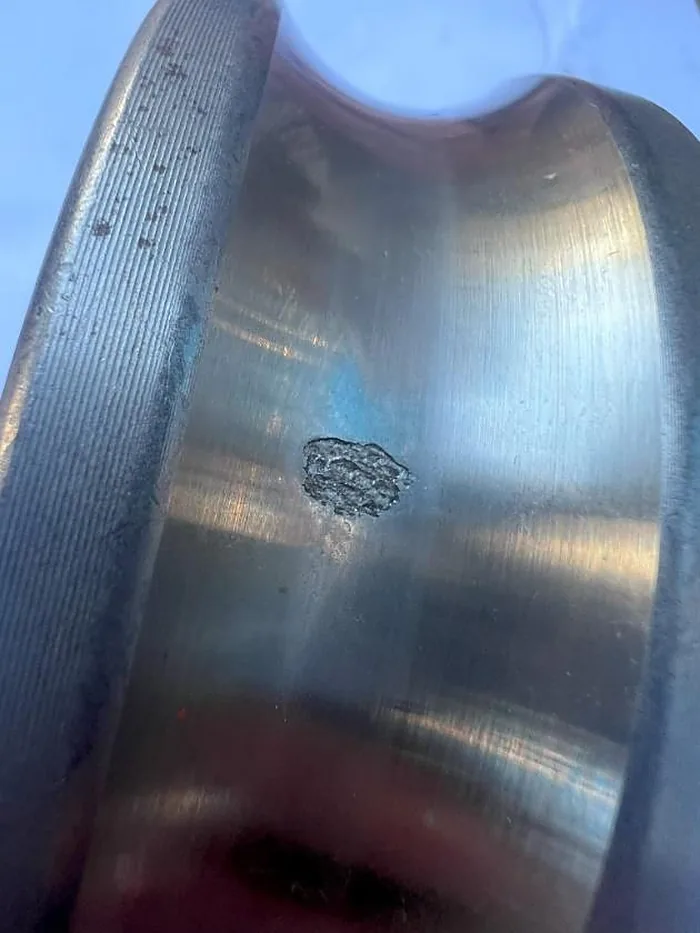
Takeaway. Low velocity does not clear a bearing. Triage on acceleration and defect indicators, then open the waveform.
Put it to work in the tool