

Resonance, critical speed and start-up data: what steady readings cannot show
A machine can read normal at full speed and still hide a resonance or a rub. Start-up and coast-down data show it, and a Bode plot is the tool.
Steady-state and transient data
Steady-state data is taken when speed and load are constant. A short snapshot is enough for most routine monitoring and for diagnosing most faults. Transient data is taken while speed or load is changing, in a start-up, coast-down or load change. Some faults only show then: resonance, rubbing, process effects and electrical faults. Large turbines and compressors take a long time to start up, so this data needs an analyzer with a large memory.
Resonance in one paragraph
Every structure has natural frequencies. When something pushes at or near one of them, the movement is amplified. For a rotor, the natural frequency shows up as a critical speed: the running speed at which the 1× push from unbalance coincides with it. Often nobody knows the value until it is measured.
The Bode plot
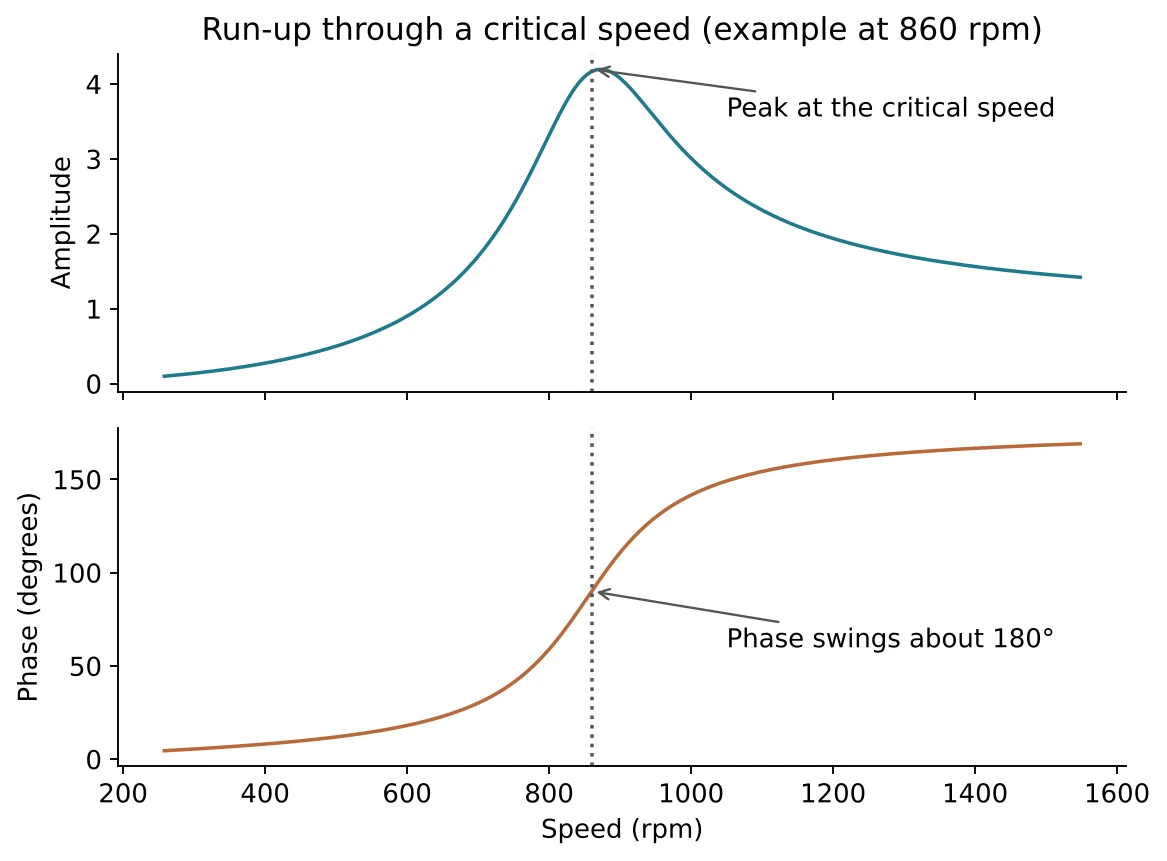
A Bode plot shows amplitude and phase against speed. Passing through a critical speed, the amplitude peaks and the phase swings by about 180°. Both signs together prove a true resonance. A peak without the phase swing is something else, such as a fault that changes with speed.
How to find a critical speed
- Set up the sensors and the once-per-turn reference, and start recording while the machine is at normal speed.
- Trip or shut the machine and keep recording while it coasts down. A run-up works too.
- Look for a sharp change in amplitude, with a phase swing, at one speed. That speed is the critical speed.
- If the machine runs above the critical speed, vibration rises as the speed falls towards it. If it runs close to it, vibration falls sharply once the speed leaves the zone.
Other transient views
| Plot | What it shows | Use it for |
|---|---|---|
| Waterfall (cascade) | A stack of spectra taken as speed changes | Seeing which peaks follow speed (orders) and which stay fixed (resonances) |
| Centreline plot | Where the shaft sits in the bearing as speed changes | Bearing wear, oil-whirl and the position of the shaft at start-up |
| Time trend | One value over days or weeks | Spotting slow change, which is the basis of condition-based maintenance |
What to do about a resonance
Keep the running speed away from the critical speed. If you cannot, change the stiffness or mass of the structure, or reduce the push, by balancing. A margin of a few tens of percent between the running speed and the critical speed is a common target, but use the machine maker's value.