

Condition monitoring
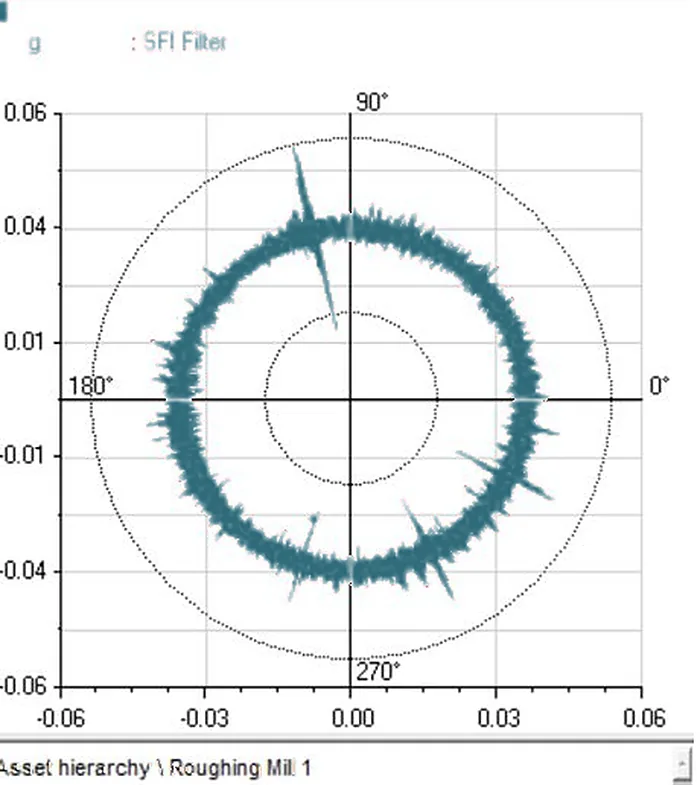
Circular plot and autocorrelation: placing one damaged tooth on a gear
Quick answer
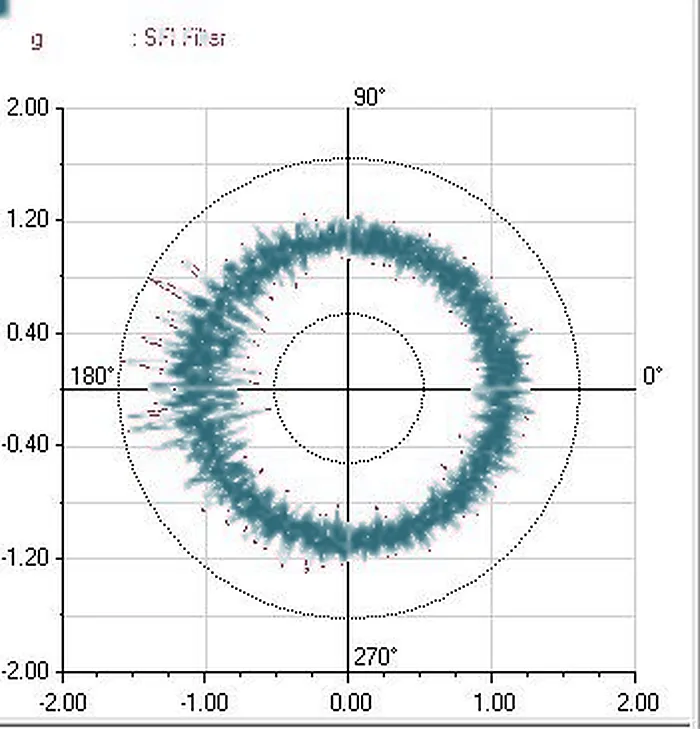
A circular plot wraps the waveform around one turn of the shaft so a fault shows up at one angle. Autocorrelation tests whether shocks repeat at a steady period. Together they turn "something repeats" into "this tooth".
What they are
- Circular (polar) plot: the vibration signal is cut into pieces one shaft turn long and laid on top of each other around a circle. A fault that happens once per turn lands at the same angle every time and builds a spike.
- Autocorrelation: the signal is compared with a copy of itself shifted by a small time. Where the shift equals the period of repeating shocks, the match is high. Random noise does not match, so it averages out.
A working order
| Step | What you do | What it tells you |
|---|---|---|
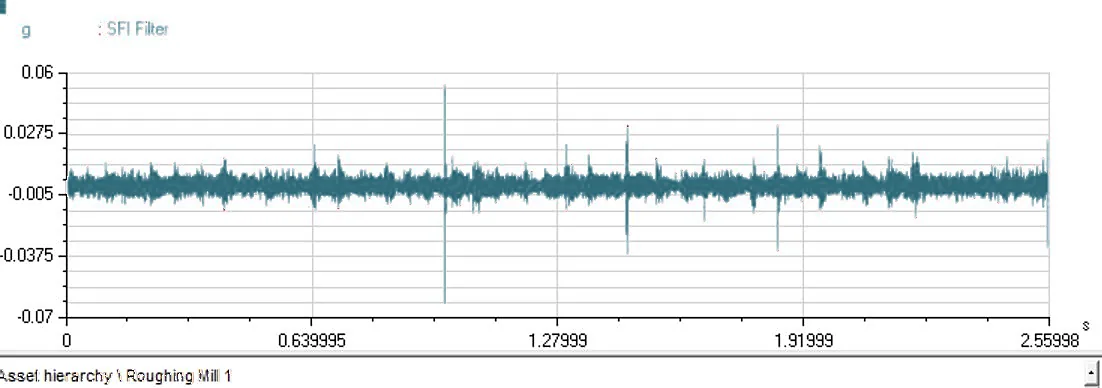
| 1 | Capture a waveform with at least ten turns of the gear shaft, in acceleration | Raw evidence |
| 2 | Measure the spacing of the shocks | Matches one turn of a particular shaft |
| 3 | Run autocorrelation | Confirms the shocks are periodic and not random |
| 4 | Draw the circular plot at that shaft's speed | Gives the angle of the damage |
| 5 | Compare with the earlier plot | Spike height tells you if it is growing |
Reading a spike and a broad band
- A single tall spike points to one damaged tooth: a crack or a break.
- A thick uneven band all round the circle points to wear or damage spread over many teeth.
- A clean thin ring is a healthy gear.
Limits
- The plot needs a steady shaft speed during capture. A speed drift smears the picture.
- It needs a speed reference, such as a tachometer, or a reliable estimate of speed.
- It shows where the damage is on the gear, not how deep. Use the amplitude trend for severity.
Takeaway. A once-per-turn shock plus a spike on the circular plot gives the angle of the tooth. Autocorrelation tells you the shocks are real.
Put it to work in the tool